
Part 5 – How to setup ‘Active Threads Over Time’ plugin
The ‘Active Threads Over Time’ plugin is a useful listener which shows you the volume of concurrent threads during your test execution. To use this plugin you need to make a few config changes first.
Step 1 – Update your jmeter.properties file
Open your local jmeter.properties file. It should be located here:
C:\apache-jmeter-3.0\bin\
Find this line in the file:
#jmeter.save.saveservice.thread_counts=false
Uncomment this line, make sure it is set to true, and save:
jmeter.save.saveservice.thread_counts=true
Step 2– Add listener to your test
Note: this plugin is not included in default jmeter install, you will need to download the Standard set of plugins and place them in this folder:
C:\apache-jmeter-3.0\lib\ext\
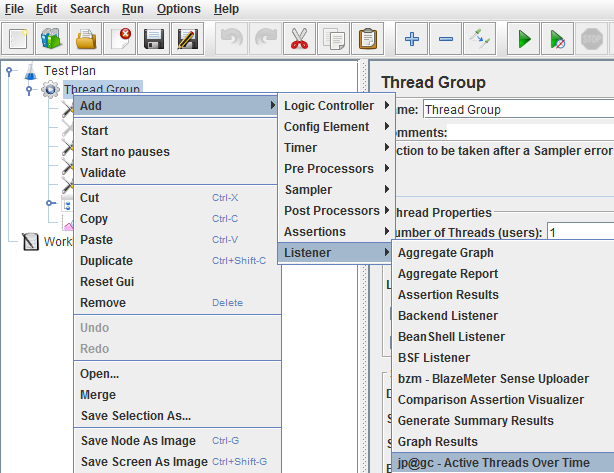
Right-click on your Thread Group to add to your test:
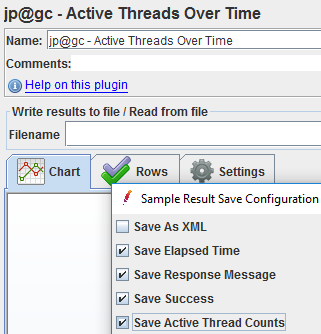
Step 3 – Edit the configuration for the listener
Click the Configure button inside the listener and check ‘Save Active Thread Counts’:
Step 4 – Try it out
Run a sample test for a minute or so. When it is finished, make sure you can view results:
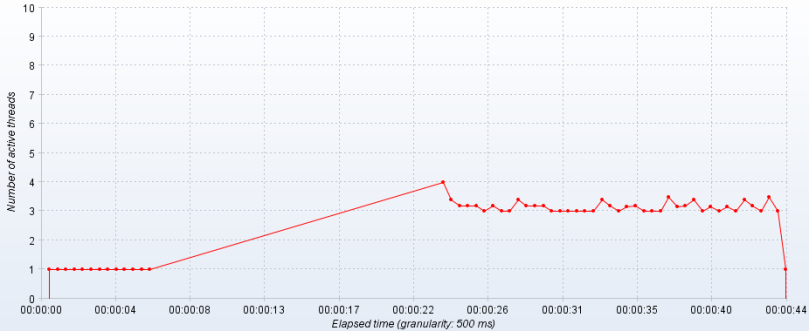
Ideally you want the shape of this graph to resemble a plateau. Any sharp peaks are red flags which should be investigated. If you want more control over concurrency (for example, you want to rampup to 25 concurrent threads and maintain this load for half an hour), try using the Concurrency Thread Group.
