Part 4 – Running Jmeter tests from the command line
The jmeter GUI should mainly be used to build and debug scripts. After becoming proficient using the GUI, you should try running from the command line. Running jmeter commands consumes less overhead on your load injector machines. Also, you can use jmeter commands to schedule tests using a continuous integration tool (i.e. Jenkins).
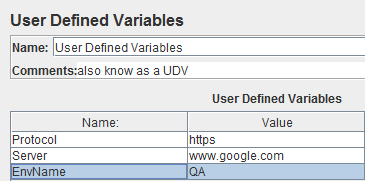
Step 1 – Double check your UDV
Make sure that your UDV is set to the correct environment.
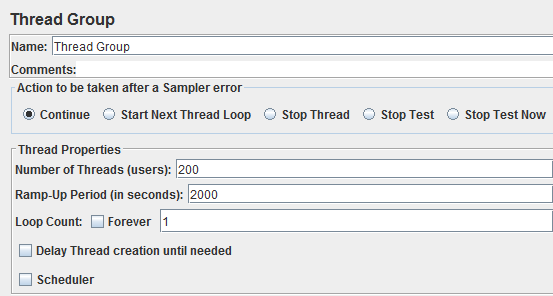
Step 2 – Make sure that your thread count is set correctly
Thread count should be 200 threads or less. Jmeter is not designed to handle much more than 200 threads in a test. If you run more than 200 threads, your test results might not be realistic and you run the risk of causing a test environment to break.
Once your thread amount is set, save your test.
Step 3 – Do a sample run
We are assuming that you already saved your test. Change the number of threads to 5 and change the rampup time to 1 or 25. Run 5 threads and make sure that they all pass.
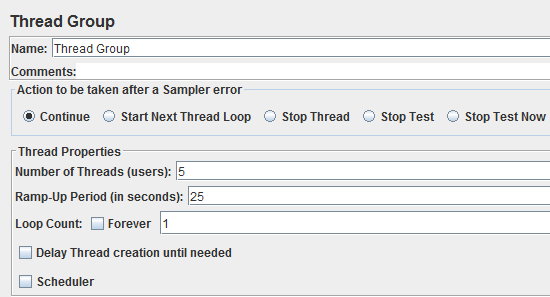
If they all fail, there is most likely an issue with your script or the application under test is not working correctly. If only one or two fail it is most likely a test data issue.
In either case, all 5 threads must pass before doing a full test run.
Step 4 – Set up your test command parameters
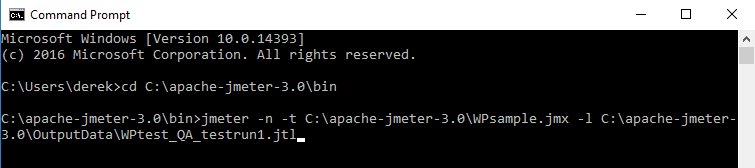
Here is a sample test command:
jmeter –n –t C:\apache-jmeter-3.0\WPsample.jmx –l C:\apache-jmeter-3.0\OutputData\WPtest_QA_testrun1.jtl
Lets break it down (hammer time):
jmeter = This is the name of the app you are running
–n = This tells jmeter to run in non-gui mode
–t = This tells jmeter where the JMX file lives
C:\apache-jmeter-3.0\WPsample.jmx = This is the location of the test you want to run
–l = This tells jmeter where to save the JTL results file
C:\apache-jmeter-3.0\OutputData\WPtest_QA_testrun1.jtl = This is the name and location of the JTL results file that will be generated by the test run. It is a good idea to specify the environment where you ran the test as well as the date.
NOTE — change the name of the results file for every test run or the results for all runs will all append to the same file.
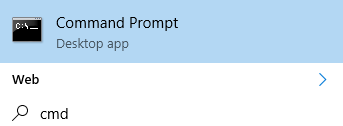
Step 5 – Open a command prompt
Go into start menu and type in “cmd”. You should see cmd.exe, click on it to run.
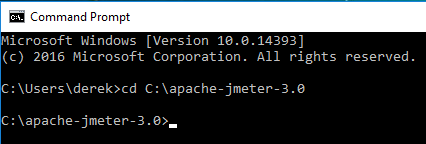
Step 6 – Change to the correct jmeter directory
Paste this command in the command prompt and click enter:
cd C:\apache-jmeter-3.0\bin
Step 7 – Paste your test command and hit enter
Step 8 – Monitor the current test run
A minute or so after starting, you should see:

- Error %
- Active threads
- Started Threads
- Finished threads
Monitor the command prompt while running and kill the test if the error % gets too high.
If you do not see anything after a few minutes, open your jmeter log to view system generated messages:
C:\apache-jmeter-3.0\bin\jmeter.log
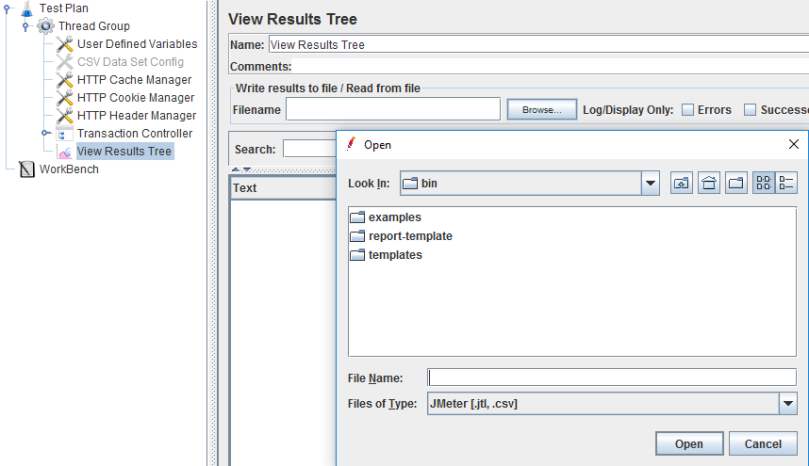
Step 9 – Open your test results for viewing
When your test run has completed, you can view the results in graphical format. Assuming that you have added listeners to your jmeter test, click the “Browse” button to use the dialog within each listener to open the JTL results file from your test run. You can change the max/min for your graphs and save as a PNG file. Alternatively, you can do a screen capture and save the image using any image editor.