
Part 1 – Getting Started with Jmeter
While UI testing is very important, in many cases not enough time is spent on performance testing. If 300 people try to place an order on your website at the same time and the server crashes, it doesn’t matter how well the UI functions. Downtime gets very expensive when your production website is down and your company is losing sales by the minute.
Jmeter is the tool that I prefer to use for performance testing:
1. It is open source and extremely portable.
2. No need to install anything besides java.
3. You can drop it on a physical machine or VM and be up and running in minutes.
4. It is industry standard and actively supported.
5. You can write your own code inside jmeter using a number of different languages.
6. They just released jmeter version 3.0, their first major release in over a decade.
(The screenshots below were taken from jmeter 3.0).
To install jmeter, download the latest binary zip from the apache.org website, then unzip it somewhere on your local drive. Locate and double-click the jmeter.bat file to launch the jmeter GUI.
You should see a skeleton test consisting of two nodes:
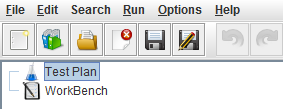
Test Plan: This will contain your samplers, listeners, controllers, etc.
WorkBench: Anything under this node will not be executed when you run or debug a test.
To start, we are going to right click to add a Thread Group under the Test Plan node:
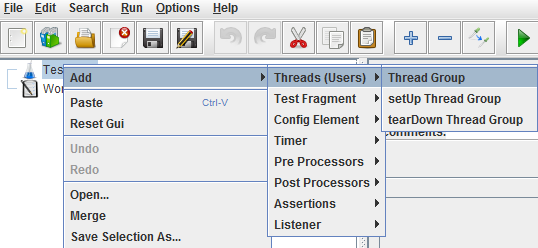
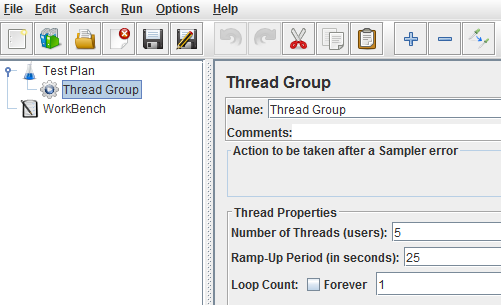
Thread Group: This is where you assign the # of threads (virtual users) and ramp up time.
Remember that (Ramp-up Period) / (Threads) = ramp-up time between each thread.
In this example (25 ramp-up) / (5 threads) = a new thread is started every 5 seconds.
Nodes with  icons are called Config Elements.
This Config Element is often referred to as a UDV and is used to store your test variables:
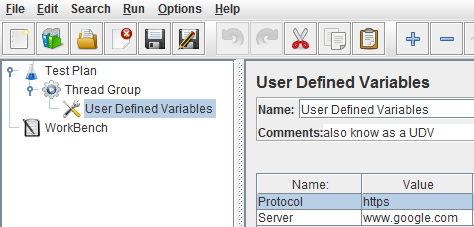
You can use these variables in other nodes in the test script by using:
${Protocol}
${Server}
Here is an example of an HTTP Request using these variables:
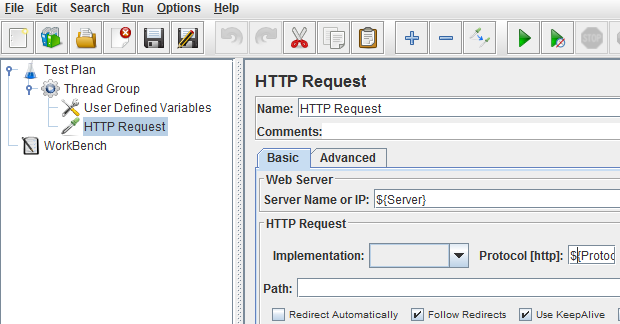
HTTP Requests are the most important elements in your test. A request generates a response from the target server. We can process the response to get meaningful data. We can also measure the response and present that data in test results. HTTP Requests can be used for submitting a variety of requests, including but not limited to: HTTP, REST, SOAP, XML, and JSON. There are older samplers which can test specific types of web services, but those are no longer supported because an HTTP Request can process all of them.
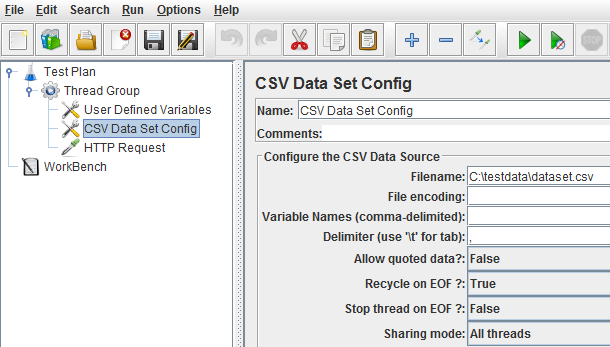
If you want your test to consume external test data from a CSV file, set the path to your input file inside a CSV Data Set Config element. Data will be pulled automatically row by row, using the column name as the variable name. For example, if the value in cell A1 = “firstName”, then the variable name for the data in that column will be ${firstName}
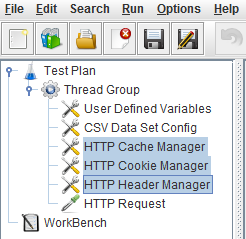
The three Config Elements below will handle your cache, cookies, and headers. Using the default values should be fine until you become more experienced using jmeter:
Nodes with this icon  are called Logic Controllers.
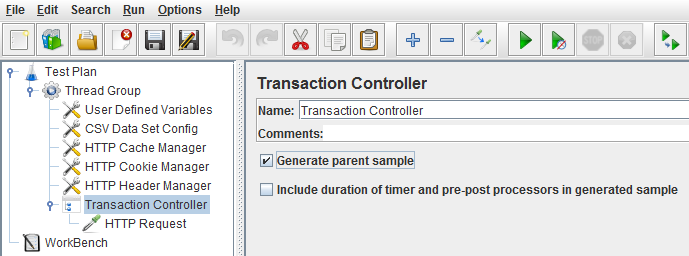
The Logic Controller below is a Transaction Controller.
These typically contain HTTP Requests, Header Managers, Processors, and Assertions.
If “Generate parent sample” is checked off, all results will be rolled up under the parent node.
Nodes with this icon  are called Post Processors.
Regular Expressions Extractors can extract data from a response and store it in a variable.
In the example below, we are extracting the value of VIEWSTATE in the HTTP response and storing it in a variable called ViewState. You can access this data in subsequent requests using the variable ${ViewState}
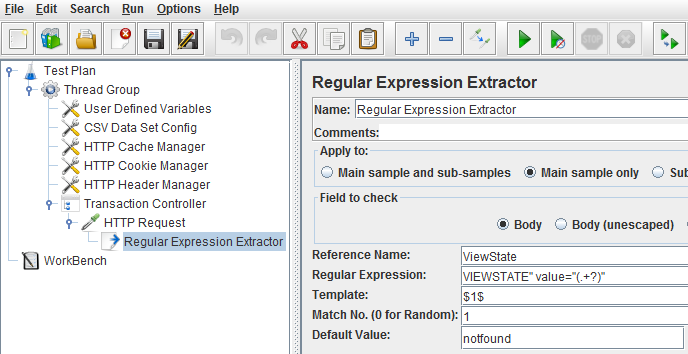
Capturing the Viewstate and passing its value into a subsequent HTTP request can be crucial to your test, especially when running tests against a .NET website. Some sites use multiple instances of ViewState/EventValidation and you will have to capture and pass all of them in order to successfully complete a workflow.
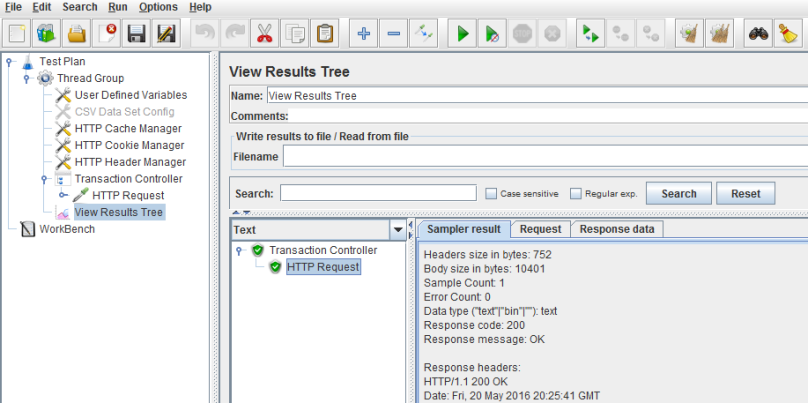
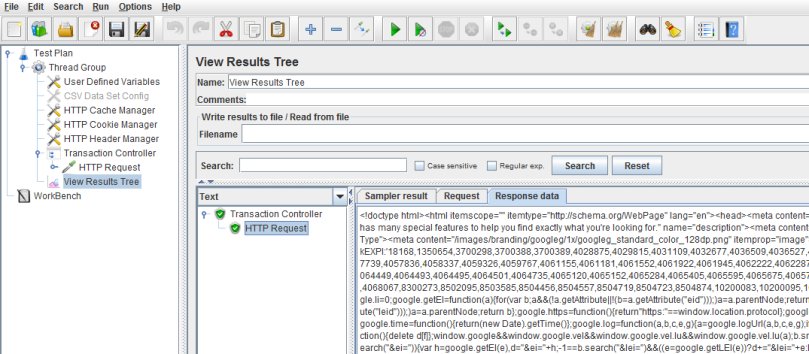
Nodes with this icon  are called Listeners. Listeners organize test results and present them as reports, tables, graphs, etc. The listener below is called a View Results Tree. This listener is very detailed and uses a good deal of overhead when running a test. It is extremely helpful when debugging a test script. If it not it being used, it should be disabled or removed.
Note the tabs on the right window:
(1) Sampler Result – this contains result data. This response code (200) is okay:
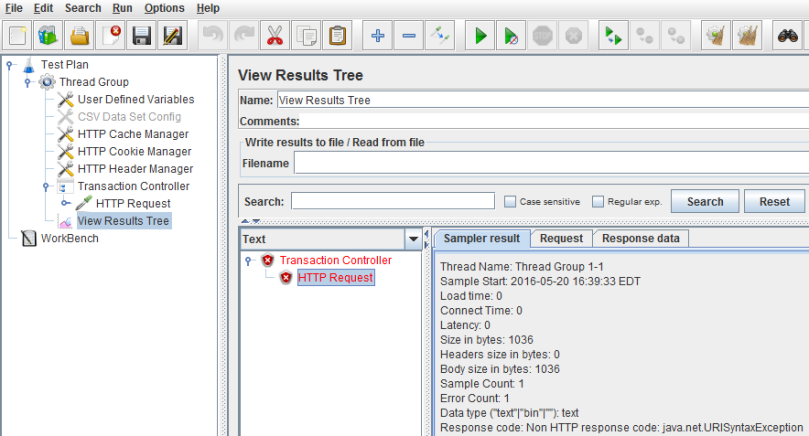
This is an example of a response that is NOT okay:
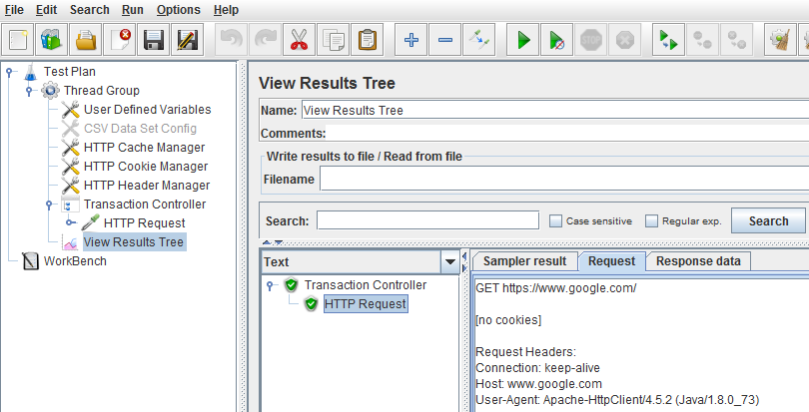
(2) Request – this displays your request to the server. This HTTP Request is a GET request:
(3) Response Data – this is the HTTP response in HTML format:
This article is intended to give a introduction to the commonly used elements of a typical jmeter script. In the next tutorial I will show how to use the built-in HTTP(S) recorder to create a script from scratch.
WARNING:
Jmeter is a very powerful tool. Do not run jmeter tests on any website that you do not have permission to run load tests against !
